Sample Response
IELTS August 2020 - Writing Task 1 Academic - Sample Band 9 Answer

The bar chart above shows the production of the world’s oil in OPEC and non-OPEC countries.
Write a short report for a university lecturer describing the information shown below.
Write at least 150 words.
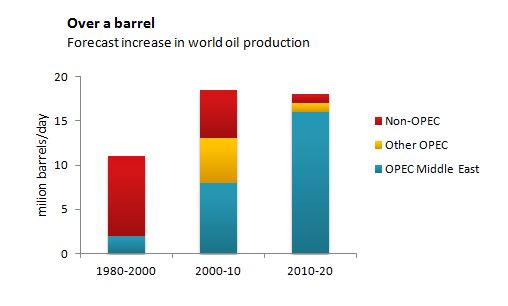
The graph presents data on the world’s oil production in both OPEC and non-OPEC countries. The statistics clearly show that the production of oil by Middle Eastern OPEC countries has risen considerably over the years.
Between 1980 and 2000, an overwhelmingly large part of world’s oil came from non-OPEC countries; of the total production of 12 million barrels only about two million came from Middle Eastern OPEC countries. Other OPEC countries did not figure in this tally.
This changed considerably in the years that followed. Between 2000 and 2010 about 12 million barrels have come from Middle Eastern OPEC countries and other OPEC countries put together. Non-OPEC countries' share was half that of these two areas.
Between 2010 and 2020, the Middle Eastern OPEC countries took over the world's supply of oil. While Other-OPEC and Non-OPEC countries accounted for about 2 million barrels each, the OPEC Middle East dwarfed this output by contributing around 16 million barrels.
Word Count: 157
Related Posts

IELTS Band 9 sample 1 - Task 2
4 years ago

Writing Better
5 years ago
Writing Evaluation
Why is understanding evaluation so important? T...
Popular Posts


Duolingo English Test
3 years ago

Related Posts
IELTS Band 9 sample 1 - Task 2
4 years ago
Writing Better
5 years ago
Writing Evaluation
Why is understanding evaluation so important? T...
Popular Posts
Duolingo English Test
3 years ago